Quickstart#
Follow along for a basic example of how to use BSAVI. Works in a Jupyter Notebook or as a standalone Python script. To see the full interactivity, download the “quickstart” notebook here.
Imports:
import pandas as pd
import numpy as np
import bsavi as bsv
Set up some random data:
data = pd.DataFrame(np.random.rand(100, 4), columns=list('ABCD'))
Now take each row of ABCD values in our data and plug them into a polynomial function:
xs = []
ys = []
for i in range(0,100):
    x = np.linspace(0, 10, 100)
    xs.append(x)
    y = data.at[i, 'A'] * x**data.at[i, 'B'] + data.at[i, 'C'] * x**data.at[i, 'D']
    ys.append(y)
poly_df = pd.DataFrame({'x': xs, 'y': ys})
To visualize this, first construct an Observable object:
polynomials = bsv.Observable(
    name='polynomials',
    data=[poly_df],
    plot_type='Curve')
This contains the basic information required by BSAVI to visualize the function:
Name: what to title the plot
data: the dataset containing the function values we just calculated
Plot Type: what kind of plot to make (i.e. curve, scatter, etc.)
Then, call the Viz function:
bsv.viz(data, observables=[polynomials]).servable()
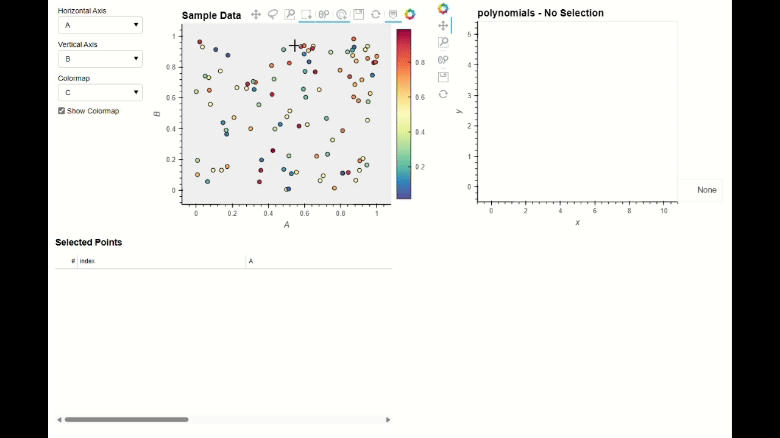
If running in a Jupyter Notebook, you should see a dashboard displayed inline. If you’d rather see it in a separate browser window, run the cell below.
server = bsv.viz(data, observables=[polynomials]).show()
Once you are done with it, stop the server with:
server.stop()
If the above code is in a standalone Python file, say “my_app.py”, run the below code in the console:
$ panel serve path/to/my_app.py
Then click on the localhost link to view the dashboard in a separate browser tab.