Welcome to BSAVI’s documentation!#
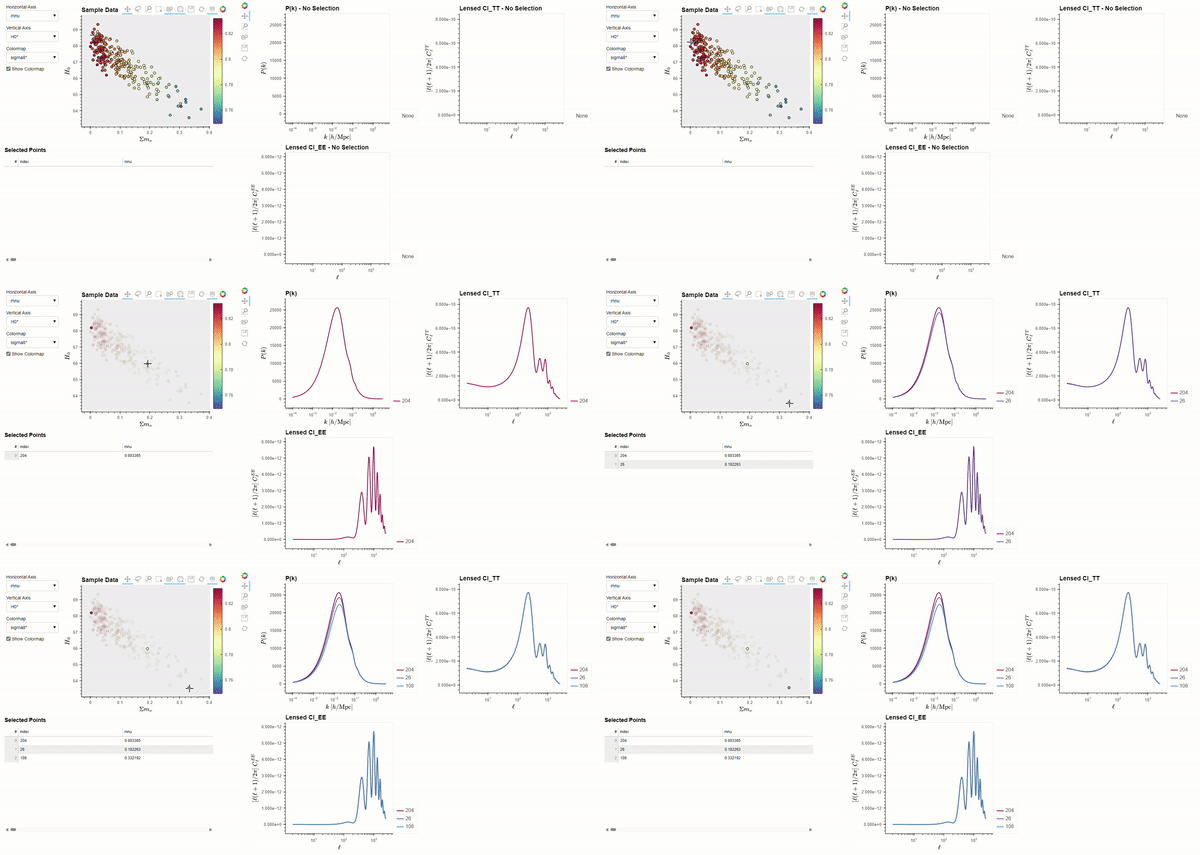
BSAVI (Bayesian Sample Visualizer) is a tool to aid likelihood analysis of model parameters where samples from a distribution in the parameter space are used as inputs to calculate a given observable. For example, selecting a range of samples will allow you to easily see how the observables change as you traverse the sample distribution. At the core of BSAVI is the Observable object, which contains the data for a given observable and instructions for plotting it. It is modular, so you can write your own function that takes the parameter values as inputs, and BSAVI will use it to compute observables on the fly. It also accepts tabular data, so if you have pre-computed observables, simply import them alongside the dataset containing the sample distribution to start visualizing!
Check out the Usage section for further information, including how to install the project. See Quickstart for a brief introduction to the code. Cosmology & CLASS has examples for how cosmologists might use BSAVI, and for an in-depth walkthrough of BSAVI and all of its features, see User Guide.

Figure 34 from the Planck 2018 Results, showing the mnu-H0 slice of the parameter space.#

Exploring this exact parameter space using BSAVI.#
Note
This project is under active development.