Cosmology & CLASS#
The CLASS code is widely used by cosmologists to simulate the evolution of linear perturbations in the universe and to compute CMB and large scale structure observables. CLASS accepts cosmological parameters as input, which we will get from the Planck 2018 results. The following code demonstrates using BSAVI to visualize the Planck 2018 results in parameter space and their relationship with three observables: the matter power spectrum \(P(k)\), and the power spectra of the CMB temperature \(C_{l}^{TT}\) and polarization \(C_{l}^{EE}\).
We will look at Table 6.7 from the Planck 2018 table of parameters. The data required for this tutorial is located here.
Pre-Computed Observables#
Let’s start with the case of pre-computed observables. A small sample was taken from the chains
and run through CLASS. The results, along with the samples themselves, are in power_spectra_small.json.
Begin by loading the data file and splitting it into chains and spectra:
import pandas as pd
planck = pd.read_json('data/planck2018/power_spectra_small.json')
chains = planck.drop(columns=['p(k)', 'cl_tt', 'cl_ee'])
class_results = planck[['p(k)', 'cl_tt', 'cl_ee']]
Read in the .paramnames file that was included with the data. This is a list of each parameter’s name in both
plain text and LaTeX. load_params will return a dictionary of these labels which we will use later.
from bsavi.loaders import load_params

params_with_latex = load_params('../data/planck2018/base_mnu_plikHM_TTTEEE_lowl_lowE_lensing.paramnames')
Now we are ready to construct an Observable which combines the observable data with plotting instructions.
import bsavi as bsv
from holoviews import opts
curve_opts = opts.Curve(logx=True)
ps_latex = {
'k': 'k~[h/\mathrm{Mpc}]',
'Pk': 'P(k)',
'l': '\ell',
'Cl_tt': '[{\ell(\ell+1)}/{2\pi}]~C_{\ell}^{TT}',
'Cl_ee': '[{\ell(\ell+1)}/{2\pi}]~C_{\ell}^{EE}',
}
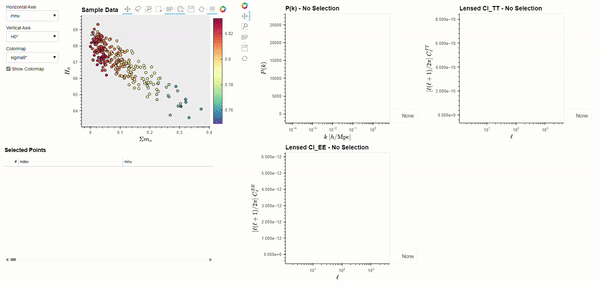
power_spectra = bsv.Observable(
name=['P(k)', 'Lensed Cl_TT', 'Lensed Cl_EE'],
data=class_results,
plot_type='Curve',
plot_opts=curve_opts,
)
Finally, produce the visualization with:
bsv.viz(data=chains, observables=[power_spectra], latex_dict=params_with_latex).servable()
Dynamically Computed Observables#
This next example requires that you have Classy, the Python wrapper for CLASS, installed.
# imports
import pandas as pd
import bsavi as bsv
from bsavi import cosmo, loaders
from holoviews import opts
As before, we load in the .paramnames file to get a dict with all the parameter names and their LaTeX code.
params_with_latex = loaders.load_params('data/planck2018/base_mnu_plikHM_TTTEEE_lowl_lowE_lensing.paramnames')
Next we will get a list of the paramname-LaTeX dict’s keys to pass into the load_chains function.
This function will take a given filename/glob pattern and try to read the files it finds into a DataFrame
with the param_names as the columns. The resulting DataFrame is 39177 rows long, so we will downsample
it to 500 to avoid overplotting.
param_names = list(params_with_latex.keys())
chains = loaders.load_chains('data/planck2018/*.txt', param_names, params_only=True)
chains = chains.sample(n=500, random_state=1).reset_index(drop=True)
Note
load_chains assumes the file is a txt file in the standard format outputted by two common cosmological
MCMC samplers, CosmoMC and Monte-Python. It will automatically skip the first two columns in each file,
which contain information about the sample weight and the negative log likelihood.
If you want that info as well, just change params_only to False.
Then we modify the table of chains into a format that CLASS will accept as input. This just involves renaming the columns and changing H0 (Hubble constant) to little h (Hubble parameter).
inclass = chains[['omegabh2', 'omegach2', 'logA', 'ns', 'tau', 'omegal*', 'yheused*', 'H0*']]
planck_names = list(inclass.keys())
class_names = ['omega_b', 'omega_cdm', 'ln10^{10}A_s', 'n_s', 'tau_reio', 'Omega_Lambda', 'YHe', 'h']
renaming_scheme = dict(zip(planck_names, class_names))
inclass = inclass.rename(columns=renaming_scheme)
inclass['h'] = inclass['h'] * 1e-2
Now, we’ll go through similar steps as above to set up our Observable, except this time we’ll use a
LiveObservable which will dynamically call cosmo.run_class.
curve_opts = opts.Curve(logx=True)

ps_latex = {
    'k': 'k~[h/\mathrm{Mpc}]',
    'Pk': 'P(k)',
    'l': '\ell',
    'Cl_tt': '[{\ell(\ell+1)}/{2\pi}]~C_{\ell}^{TT}',
    'Cl_ee': '[{\ell(\ell+1)}/{2\pi}]~C_{\ell}^{EE}',
}

power_spectra = bsv.LiveObservable(
    name=['P(k)', 'Cl_TT', 'Cl_EE'],
    myfunc=cosmo.run_class,
    myfunc_args=(inclass,),
    plot_type='Curve',
    plot_opts=curve_opts,
    latex_labels=ps_latex
)
Notice that in creating the LiveObservable, we only passed in a single function and its arguments, but passed
multiple names. This is because cosmo.run_class will return data for all three observables.
When writing your own functions for LiveObservables, make sure it returns all the data you need.
See the User Guide for more information.
And finally, we can produce the visualization with
bsv.viz(data=chains, observables=[power_spectra], latex_dict=params_with_latex).servable()